When researchers want to create data visualisations about contentious, complicated issues such as migration, what should they be aware of? And, when they collaborate with other organisations to create these outputs, what steps would help produce more effective outcomes?
In my research on visualisations (Seeing Data) with Helen Kennedy (University of Sheffield), Rosemary Lucy Hill (University of Leeds) and Andy Kirk (www.visualisingdata.com), we wanted to explore whether it was possible to make ‘effective’ data visualisations. Part of the answer involved pointing out that ‘effectiveness’ isn’t one-size-fits-all. We found it can mean different things depending on several factors: the situations that people look at visualisation; the interests, abilities, and backgrounds of viewers; and the intention of the visualisation itself. (In a previous COMPAS blog, I explored how visualisations can be persuasive, too).
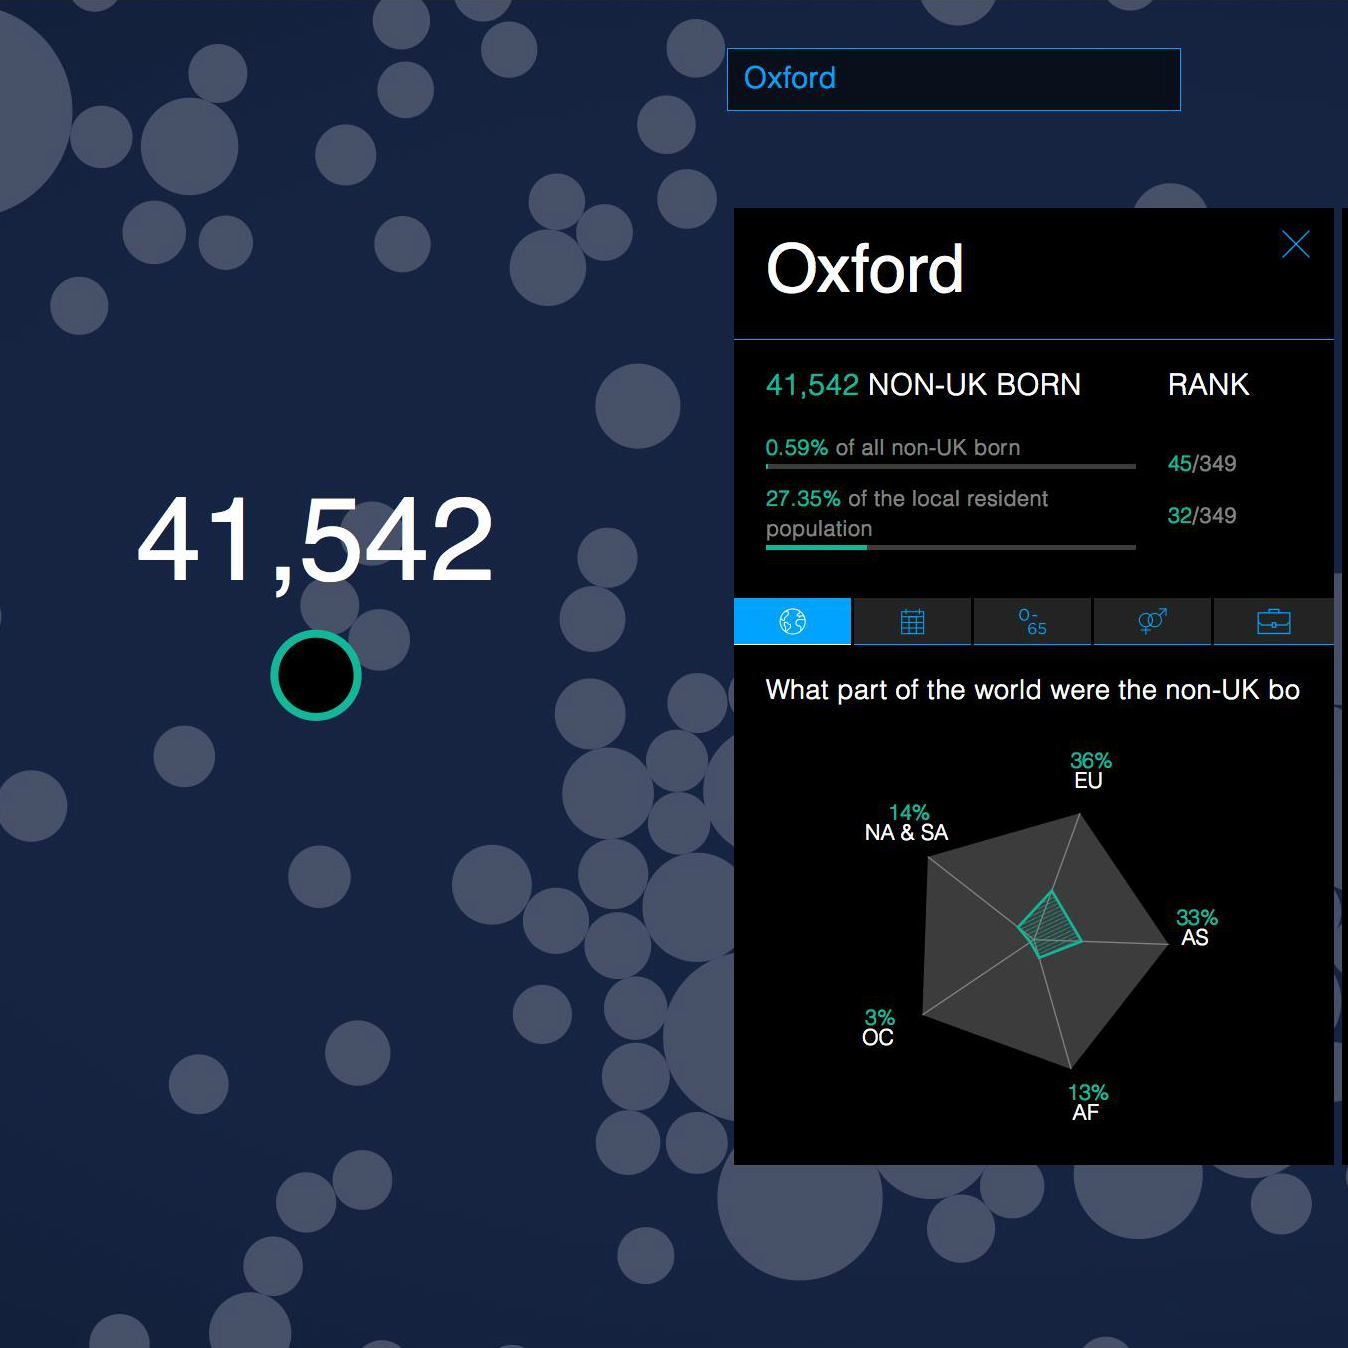
During the project, we also commissioned some visualisations for The Migration Observatory from a professional design company, CleverFranke. One of them focused on key results from the 2011 UK Census. The other focused on the ways that the British press has talked about immigration. We did this for two reasons: first, to produce some outputs that we later used in focus groups around the UK; and second, to examine the process of creating visualisations up-close. Some of my research focuses on how groups that link researchers with policy and civil society (called ‘intermediaries’) engage with migration-related evidence and data.
So, I wanted to see how an organisation like the Observatory and an outside design studio would work together. Two lessons, which aren’t directly related to the technical side of making visualisations, came out of this experiment. (If you’re interested in learning how to make visualisations, check out the ‘Further Reading’ section at the end of this post). I think these lessons apply in other situations where researchers want to engage with others through data visualisations:
(1) consider the aims and values of intermediary partners; and,
(2) acknowledge different areas of expertise and develop communication strategies accordingly.
Consider values and aims of partners (and ourselves)
Intermediary organisations, just like all groups involved in research, also have objectives and missions. They repackage and translate research for a variety of purposes: to inform, to persuade, to advocate. In the case of the Observatory, some of its guiding values include transparency, independence, and comprehensiveness. These values help guide the choices and directions involved in any outputs—including data visualisations. In practice, this means that all choices and limitations need to be accounted for, and signaled to users. So, for example, to enhance transparency, the designers made sure to include explanatory text about the methods and data collection in the final products. Also, the visualisations—as far as possible—include as much information about all regions or newspapers where possible, without assuming what the user will find interesting in the first place. This aligns with the values of comprehensiveness and independence.
This reflection also applies to researchers themselves. What motivates the study in the first place? What is the intended goal of the visualisation? Even if we aren’t drawing upon external design companies, we should still ask ourselves similar questions to improve our own visualisation practice.
Acknowledge different kinds of expertise
When researchers engage with intermediaries, designers, and even other academics, everyone brings different sets of skills and levels of familiarity with the project topic. While this may initially seem to be a position of strength, it does require time and energy to ensure that diverse perspectives do not lead to divergent paths! For example, in our project, the designers were Dutch professionals who relied upon Observatory team-members’ knowledge of the British case to interpret the patterns that emerged from the datasets. Also, the visualisers and researchers met at the beginning of the project to meet face-to-face. This was a key moment when all participants could develop a sense of the others’ communication styles and personal motivations.
Although it seems obvious to include time for these kinds of exchanges, I can’t overstate how important it is, especially in complex visualisation projects involving several stakeholders. After all, it’s well-documented how social factors like trust and respect also impact how exchanges turn out.
Visualisation as a brokered process
These two non-technical lessons—to consider the role of values, and to acknowledge all partners’ own skills and perspectives—echo some of the academic studies about ‘knowledge brokerage’. Public-facing outputs based on research, like reports, briefings, statistical bulletins, and press releases often involve input or influence from many groups along the way.
My research argues that data visualisations are also a type of brokered outputs. So, we in migration studies can stand to learn a great deal from the evidence and policymaking field, where scholars document how information is actually used by non-academic groups. Being sensitive to the ways that brokerage activities unfold not only reveals how academic knowledge exists in contexts, but also invites us to think critically about our own public engagement practices—and, hopefully, how to improve them.
This post is based on a forthcoming article: Allen, William (2018), ‘Making Corpus Data Visible: Visualising Text With Research Intermediaries’, Corpora 13(1). The pre-print version is available here.
About the author: William Allen (@williamlallen) is a Research Officer with the Centre on Migration, Policy, and Society (COMPAS) and The Migration Observatory. He focuses on the links among media, policy, and public attitudes towards migration, as well as how groups outside of universities use and communicate migration research. His research investigating how British civil society organisations engage with social scientific evidence won the inaugural 2016 Carol Weiss Prize for an early-career researcher by the journal Evidence & Policy.
Further Reading
Gatto, Malu A.C. (2015) Making Research Useful: Current Challenges and Good Practices in Data Visualisation’, Reuters Institute for the Study of Journalism: University of Oxford
Helen Kennedy, Rosemary Lucy Hill, Giorgia Aiello, and William Allen (2016) ‘The Work That Visualisation Conventions Do’ Information, Communication & Society, 19(6): 715-35
Kirk, Andy (2016) A Handbook for Data Driven Design, London: SAGE
Kathryn Oliver, Simon Innvar, Theo Lorenc, Jenny Woodman, and James Thomas (2014) ‘A Systematic Review of Barriers To and Facilitators of the Use of Evidence by Policymakers’ BMC Health Services Research, 14(1): 1-12