When we see a chart or graphic (sometimes called a data visualisation), it’s tempting to think ‘these are just fancier ways of presenting a lot of numbers, right?’ In a way, that’s exactly what these images are: different ways of representing data to enable understanding. But in another way, these actually can become windows into a variety of stories contained within the numbers.
 In November 2018, as part of the Festival of Social Science hosted by the UK’s Economic and Social Research Council, I worked with actREAL to creatively explore what it might be like to step inside visualisations about immigration. We developed a series of short performances and activities that aimed to communicate two key points: there are human voices that make up datasets like censuses or surveys, and people often bring different perspectives when they look at the same image.
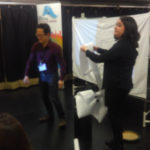
We started with an opening sketch to introduce the idea that many statements about a whole group (like ‘38% of people in Oxford’) are actually made up of lots of individual responses. These individuals, although they may give useful answers for specific questions, can’t be reduced to a single aspect.
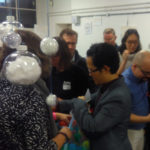
Then we welcomed everyone to enter Visualisationville—a world inhabited by all sorts of visualisations on any topic imaginable. Even the sky contained ‘word clouds’ made up of public responses to visualisations, clustered by how positive or negative they were. As people explored this area, they got a sense of data in physical forms rather than mere tables. 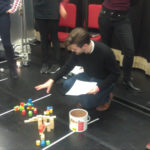
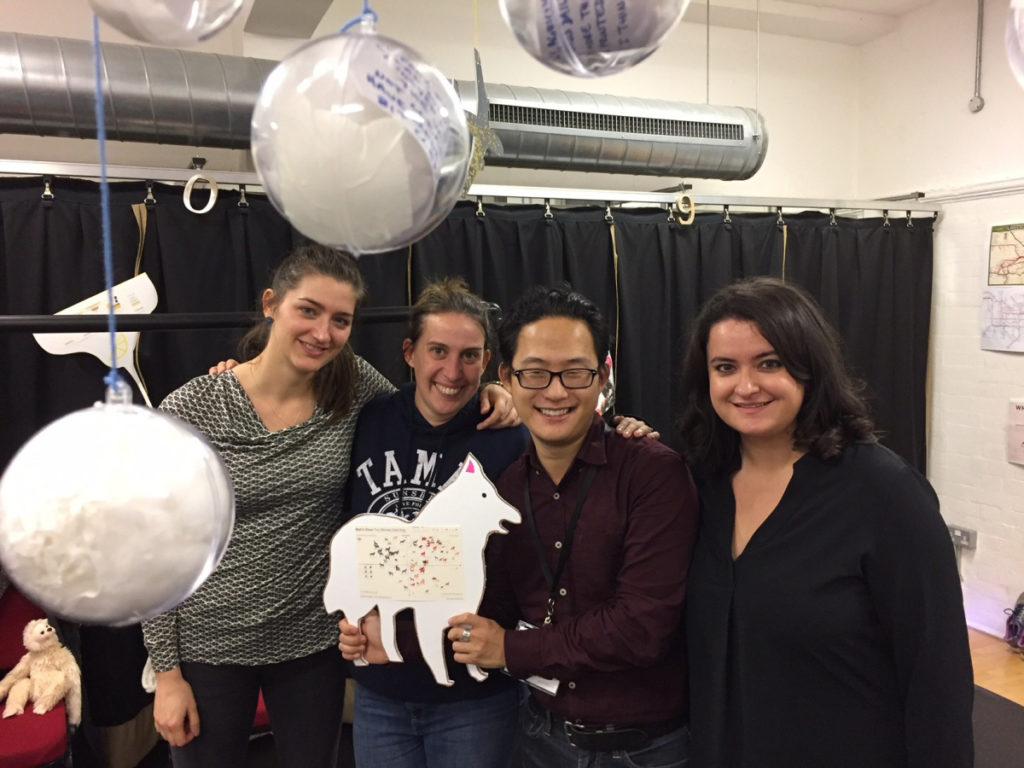
Later, they formed themselves into a living chart that expressed where they had been born, by region of the world. In this activity, two individuals from Turkey chose to stand outside the given options that included ‘Europe’ and ‘the rest of the world’. This was an interesting illustration of how individuals may not fit into the neat categories presented by surveys.
 Finally, we shared findings from two migration-related research projects: one on the perceptions of "Go Home" vans that were promoted by the UK’s Home Office, and another on the experiences of young people who were living in the UK without immigration documents. We placed this concluding set of monologues, excerpted from real interviews, next to statistics about the affected populations in order to illustrate how numbers and narratives can—and often do—go hand in hand.
Although it’s too early to say whether these specific kinds of creative techniques are more effective and memorable than other approaches, what was clear from the immediate feedback was that participants enjoyed the opportunity to discuss and think about issues in new ways. They also liked seeing how emotions can go hand in hand with numbers—from the serious personal stories of undocumented minors, to the humour of some physical comedy. Going forward, I’d like to test to what extent messages conveyed through theatre and performances can impact what people think about political issues. (A colleague of mine did a fantastic study that demonstrated how a play exploring themes of crime and justice from the perspective of young people caused shifts in audience members’ perceptions).
 There are also benefits for researchers. When I talk about how I engage with theatre and performance in my research, I am often asked ‘what is the added value of doing those kinds of activities? Doesn’t it distract from doing real research?’ I often respond that the creative arts are more than just a means of communicating social science research to the wider public—although that’s an enormously important feature, especially when much of my research is publicly funded.
Rather, as demonstrated by these interactive evenings, these activities enable me to learn more about how people engage with information in real-time. As a result, they generate new questions and insights that shape the directions of my ongoing research, sometimes in ways I couldn’t have predicted beforehand.
This blog post originally appeared on the actREAL blog, 28 January 2019. All photographs are the property of actREAL and may not be used without their permission.